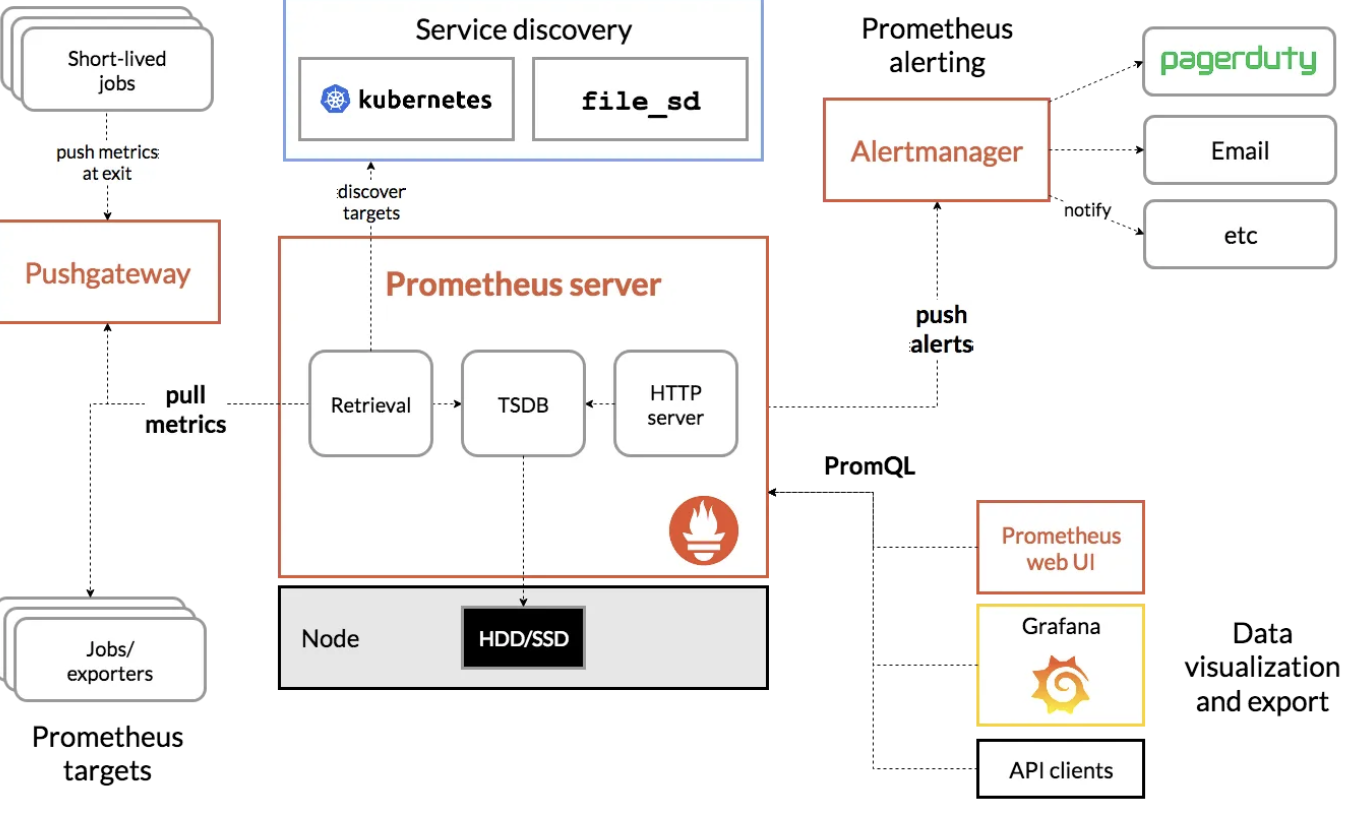
Prometheus_and_grafana
Contents
Prometheus
https://www.youtube.com/watch?v=h4Sl21AKiDg
Prometheus Server, Pushgateway, Alertmanager
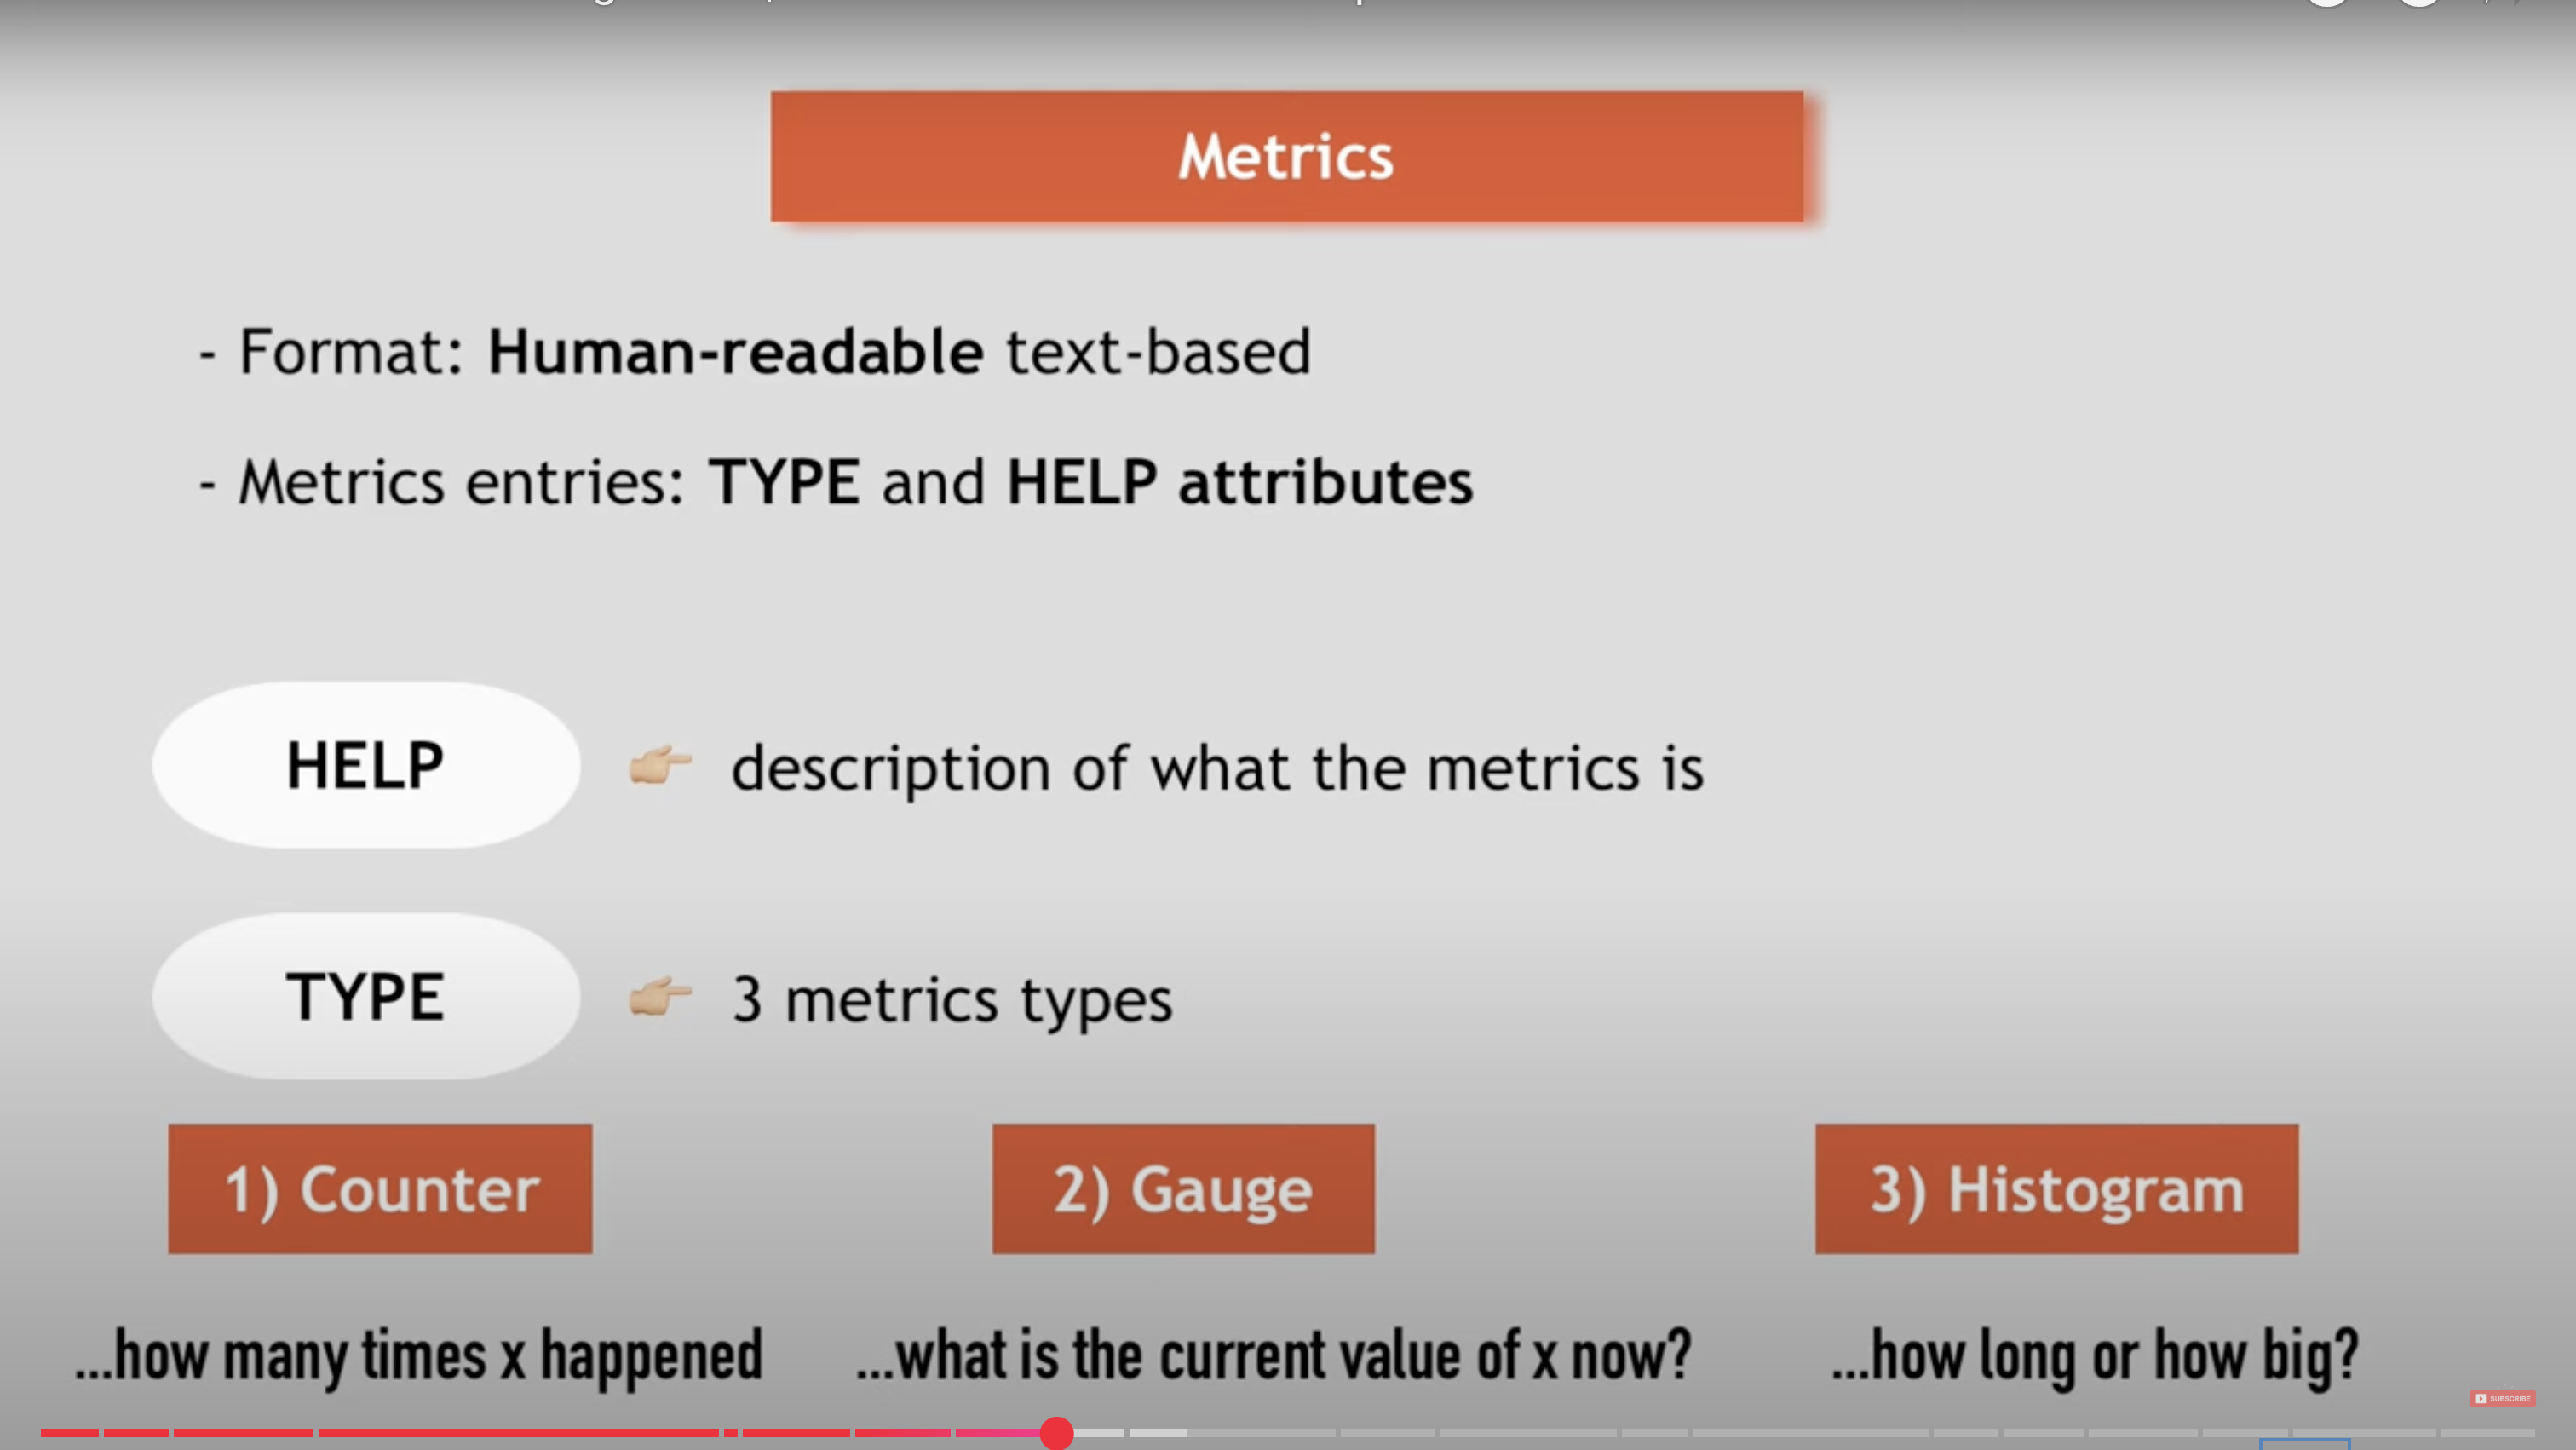
https://prometheus.io/docs/concepts/metric_types/
https://itnext.io/prometheus-for-beginners-5f20c2e89b6c
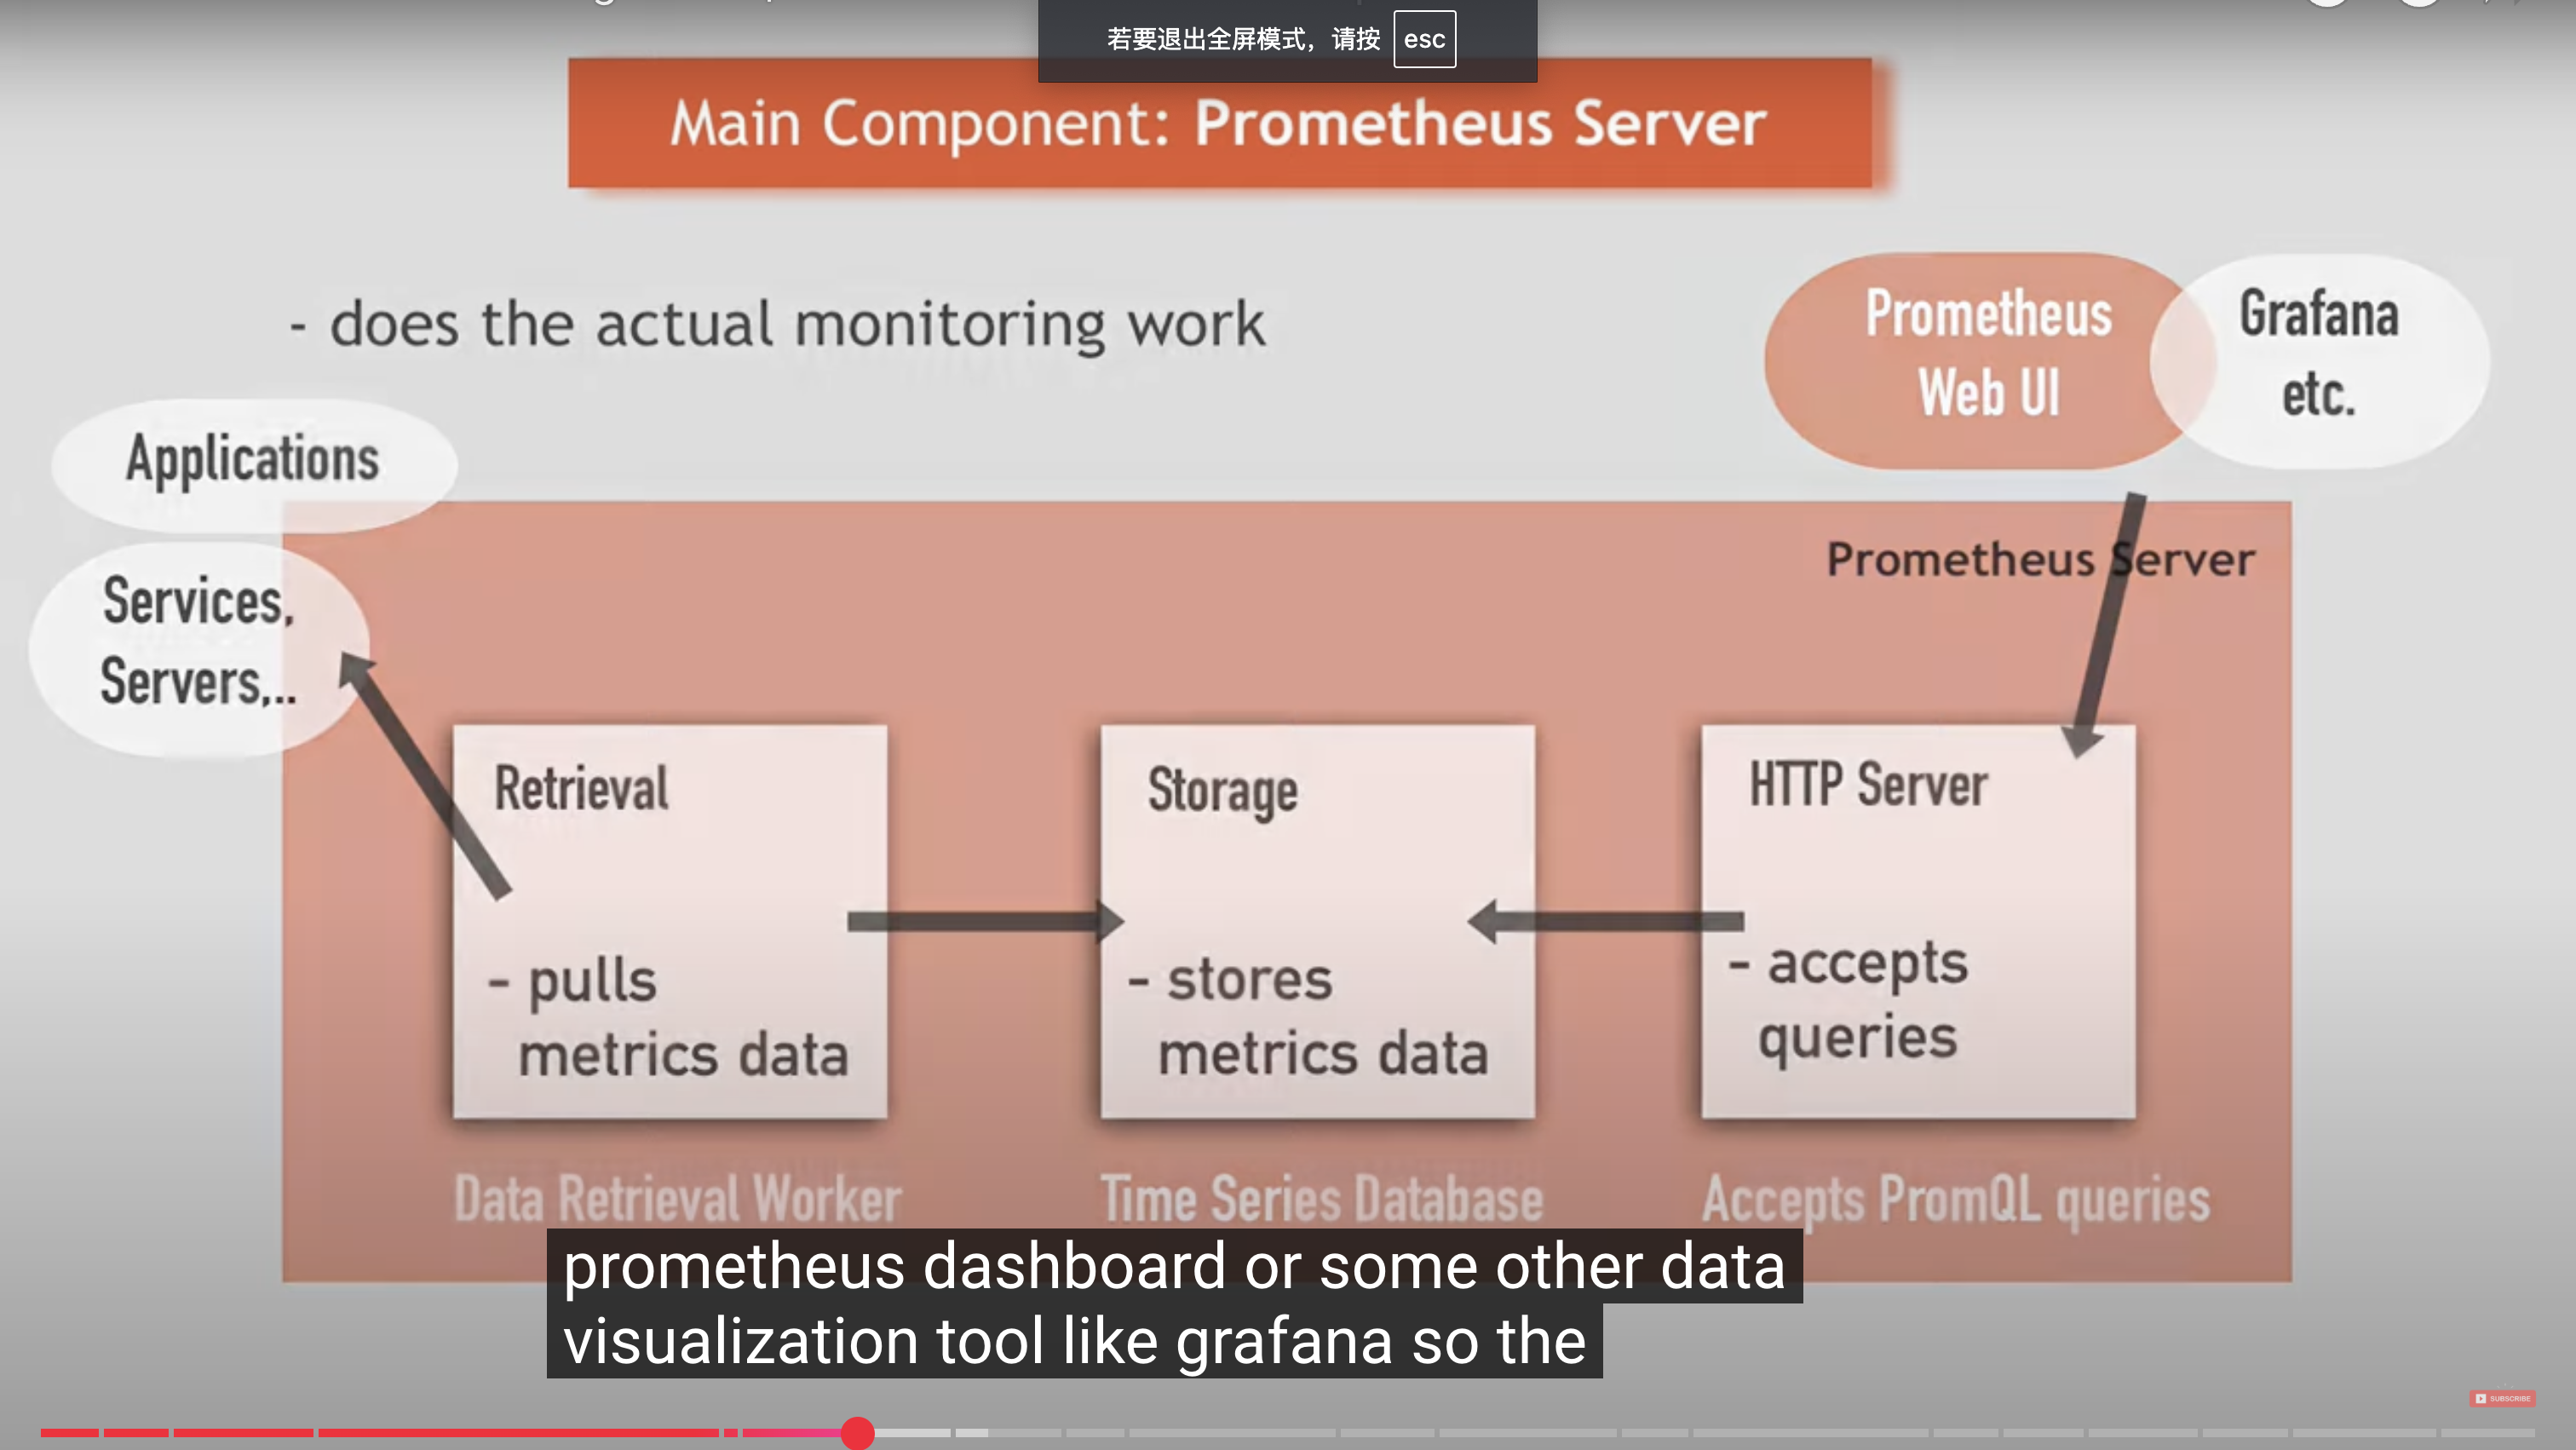
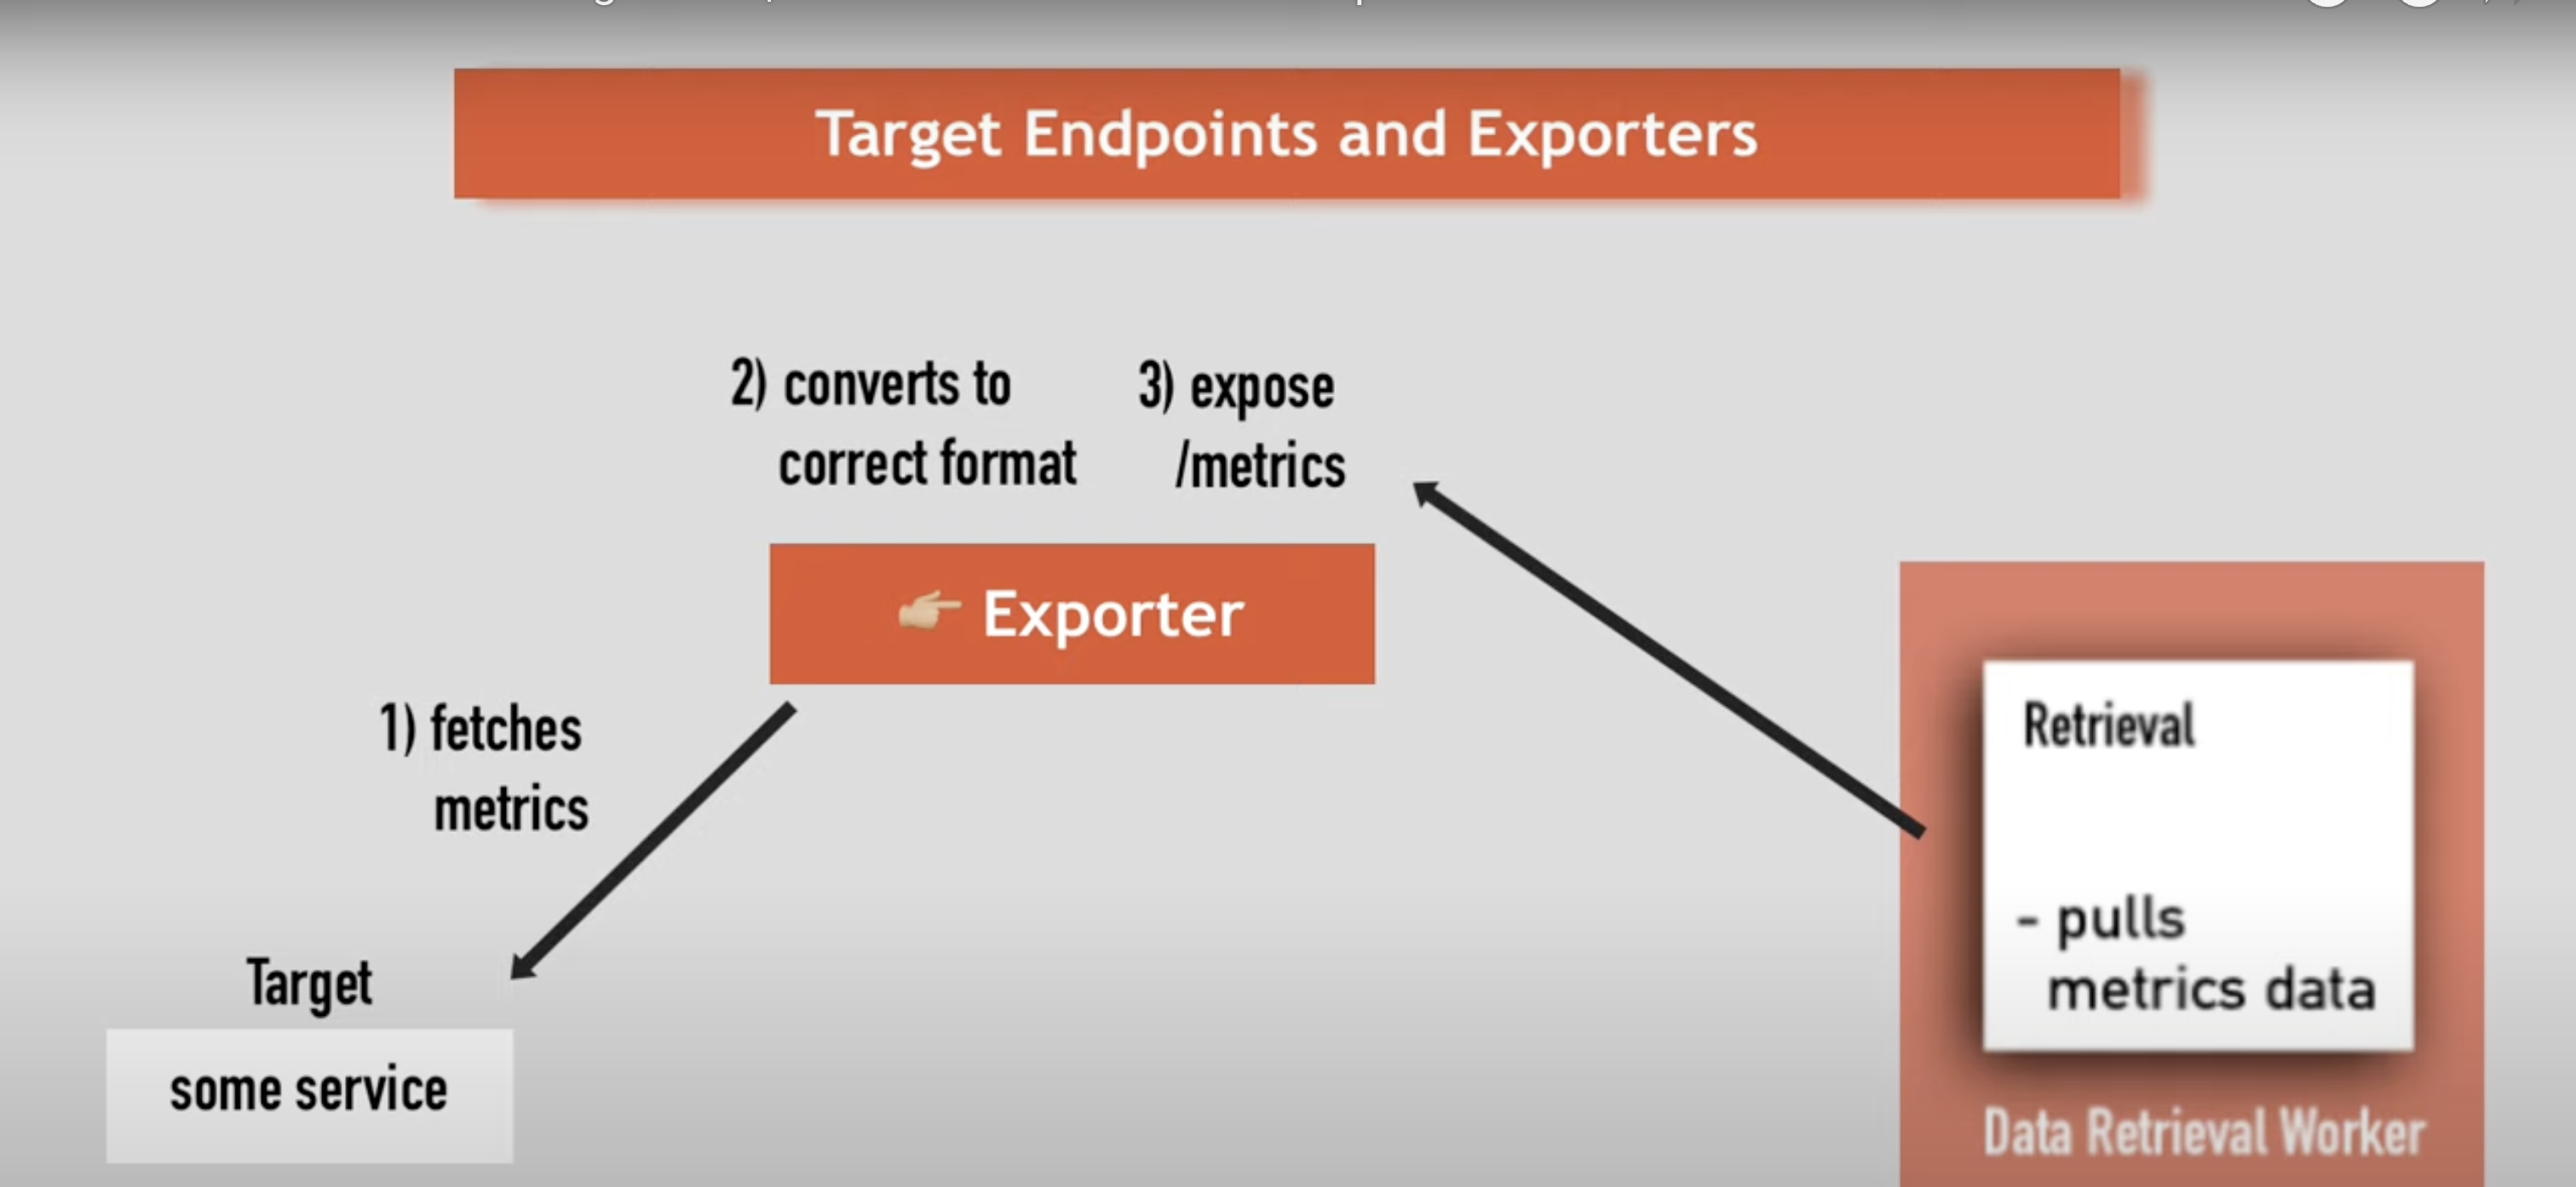
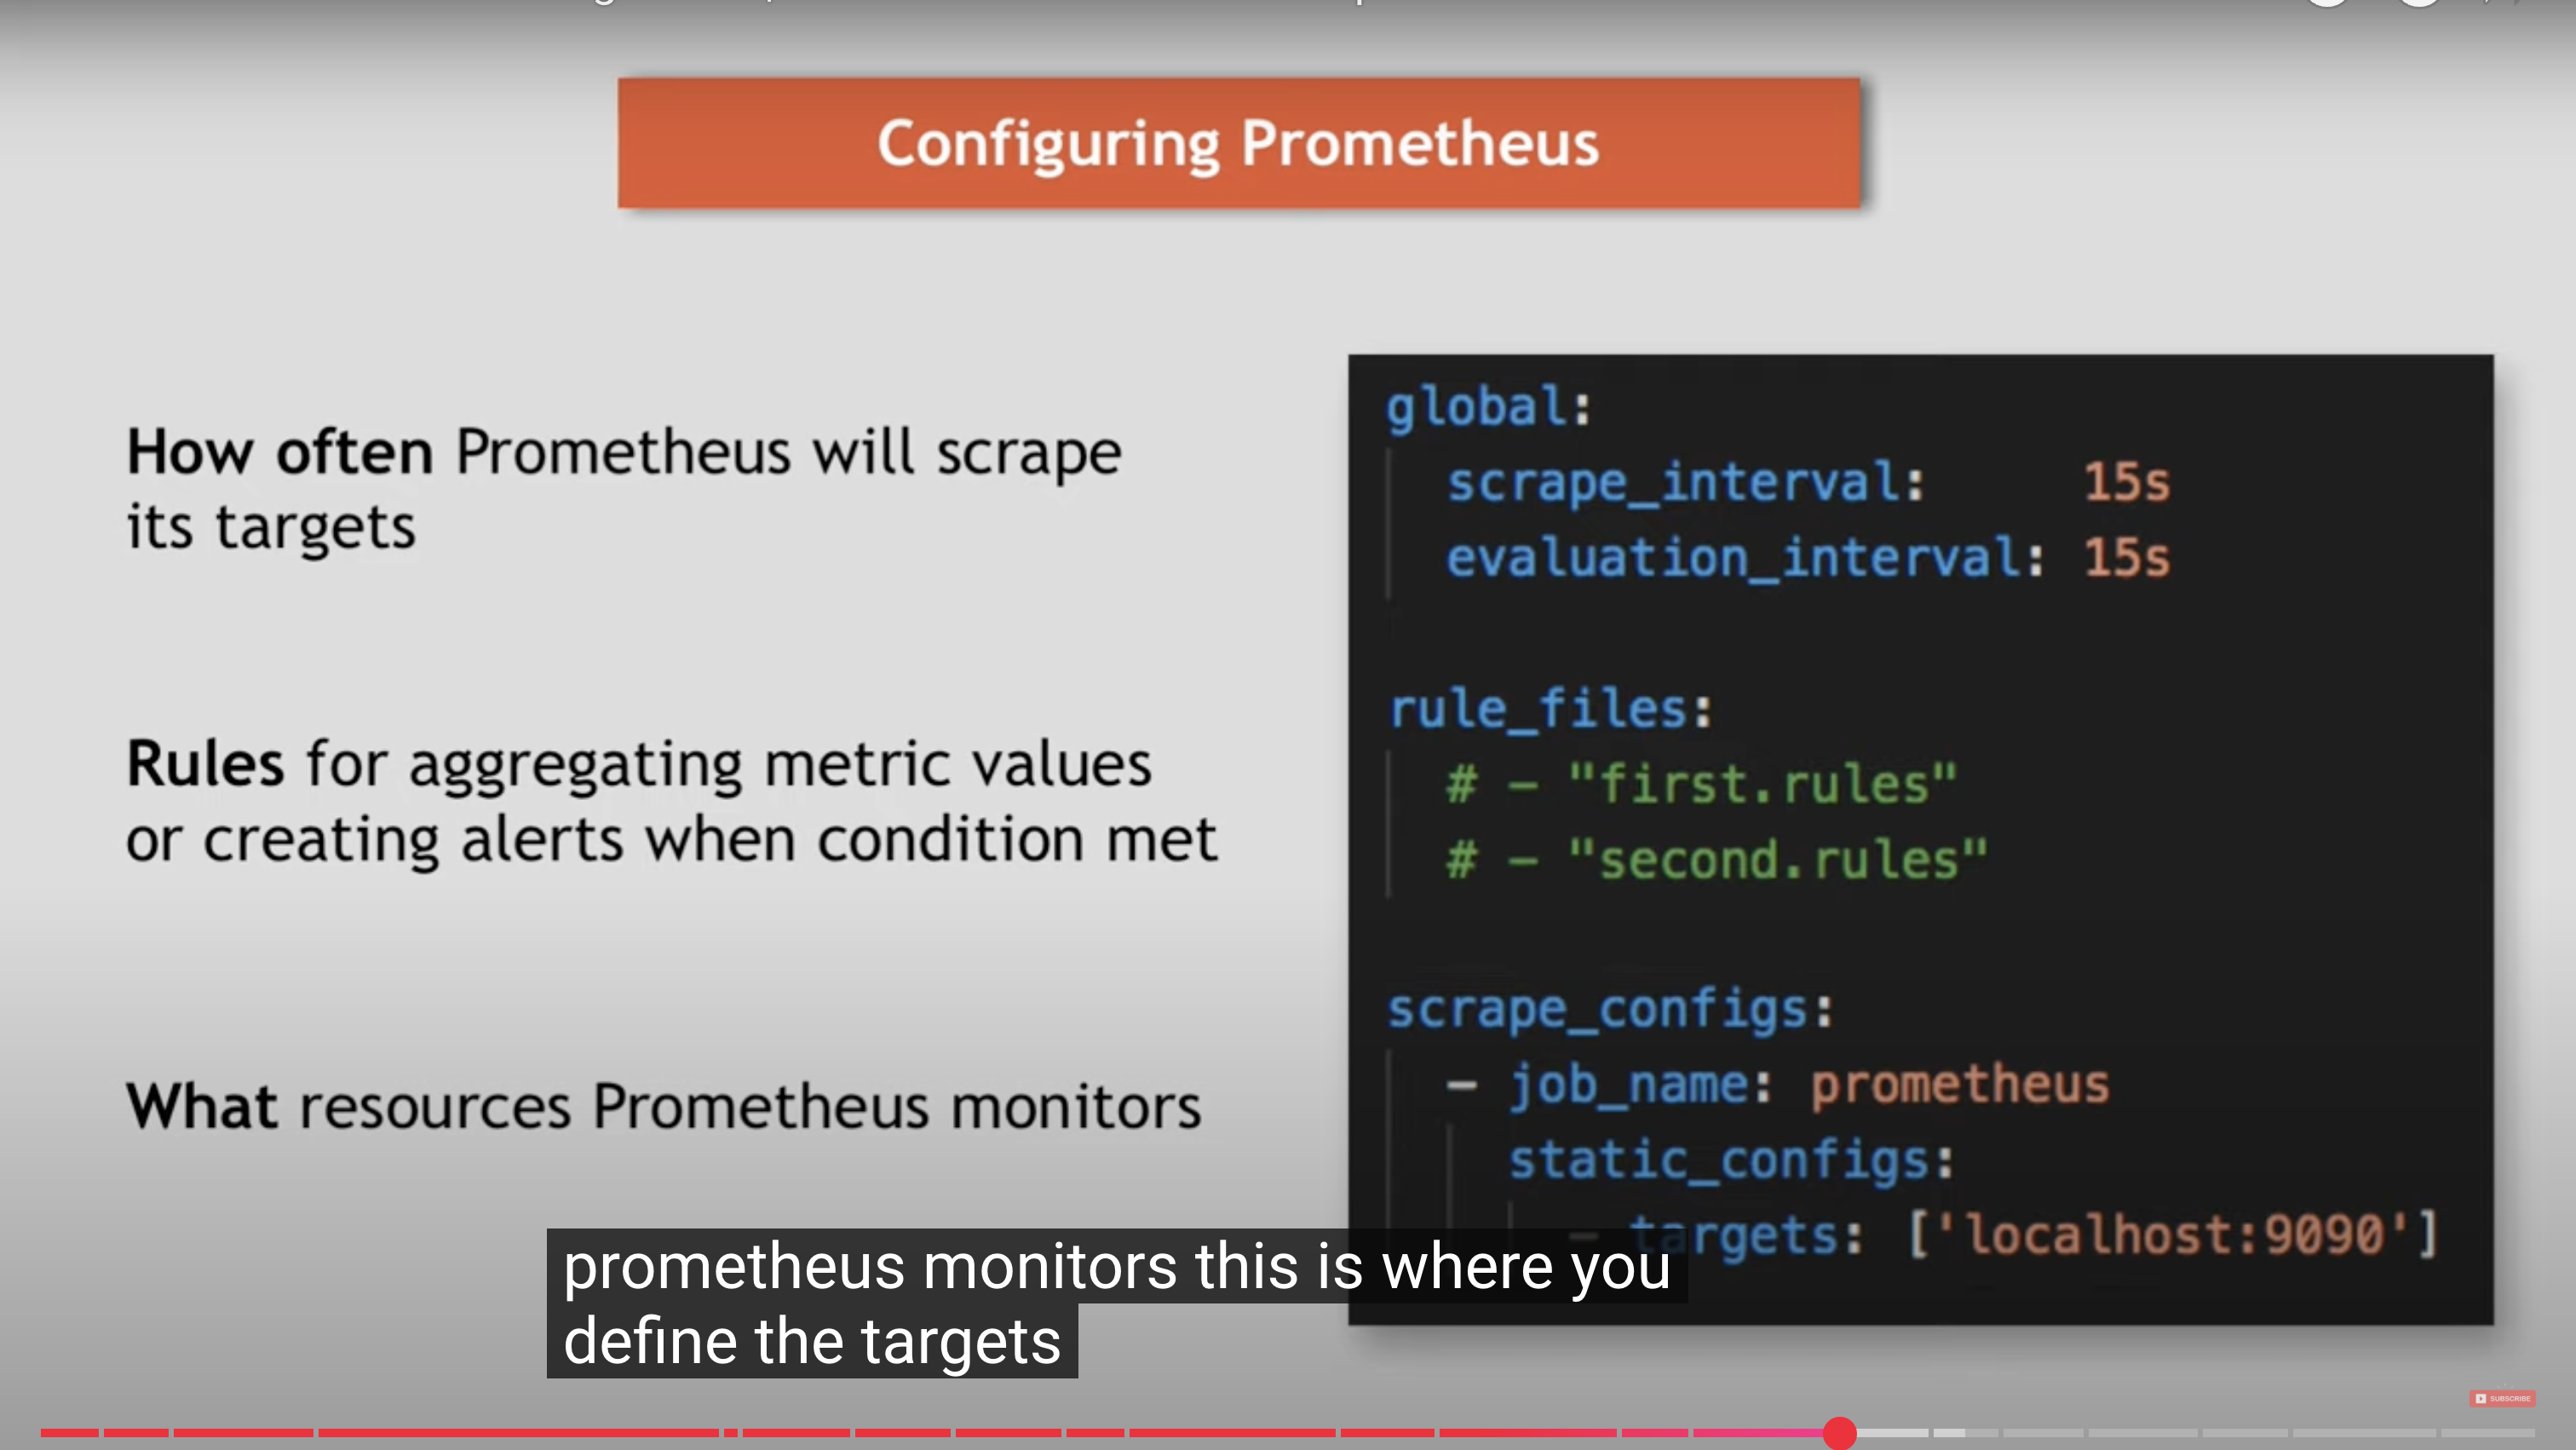
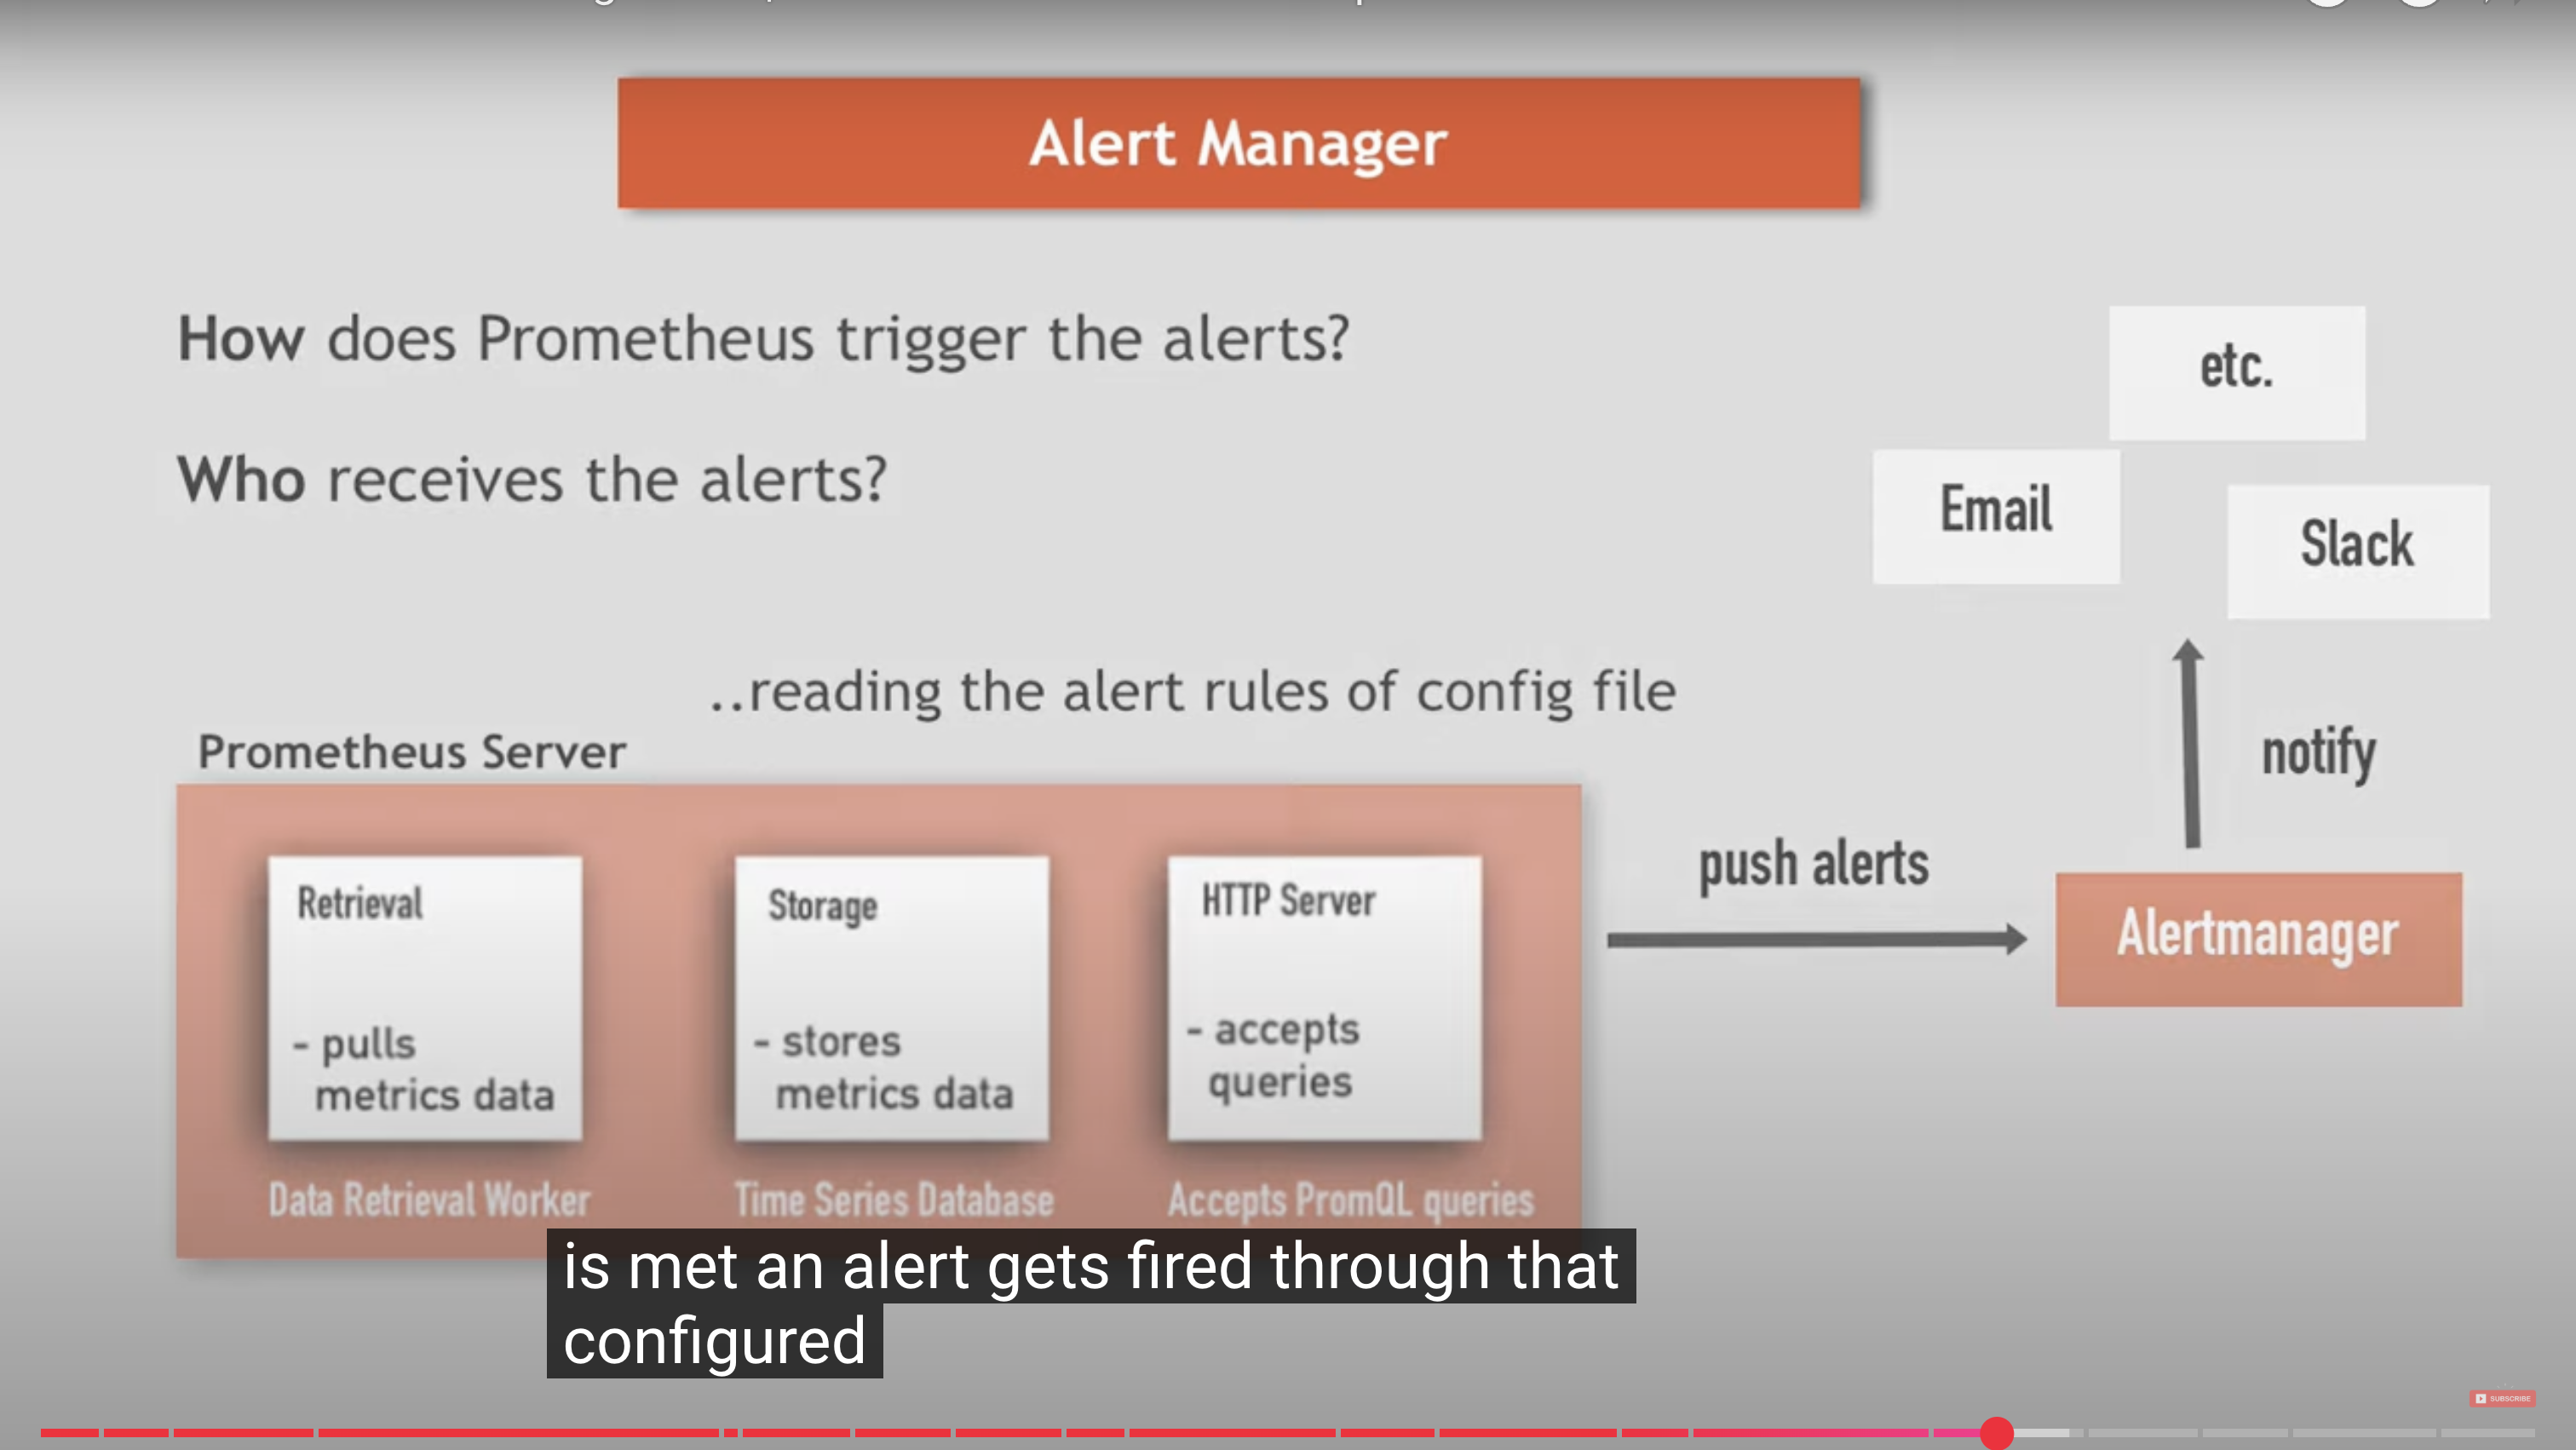
Prometheus is essentially just another metrics collection and analysis tool, and at its core it is made up of 3 components:
- A time series database that will store all our metrics data
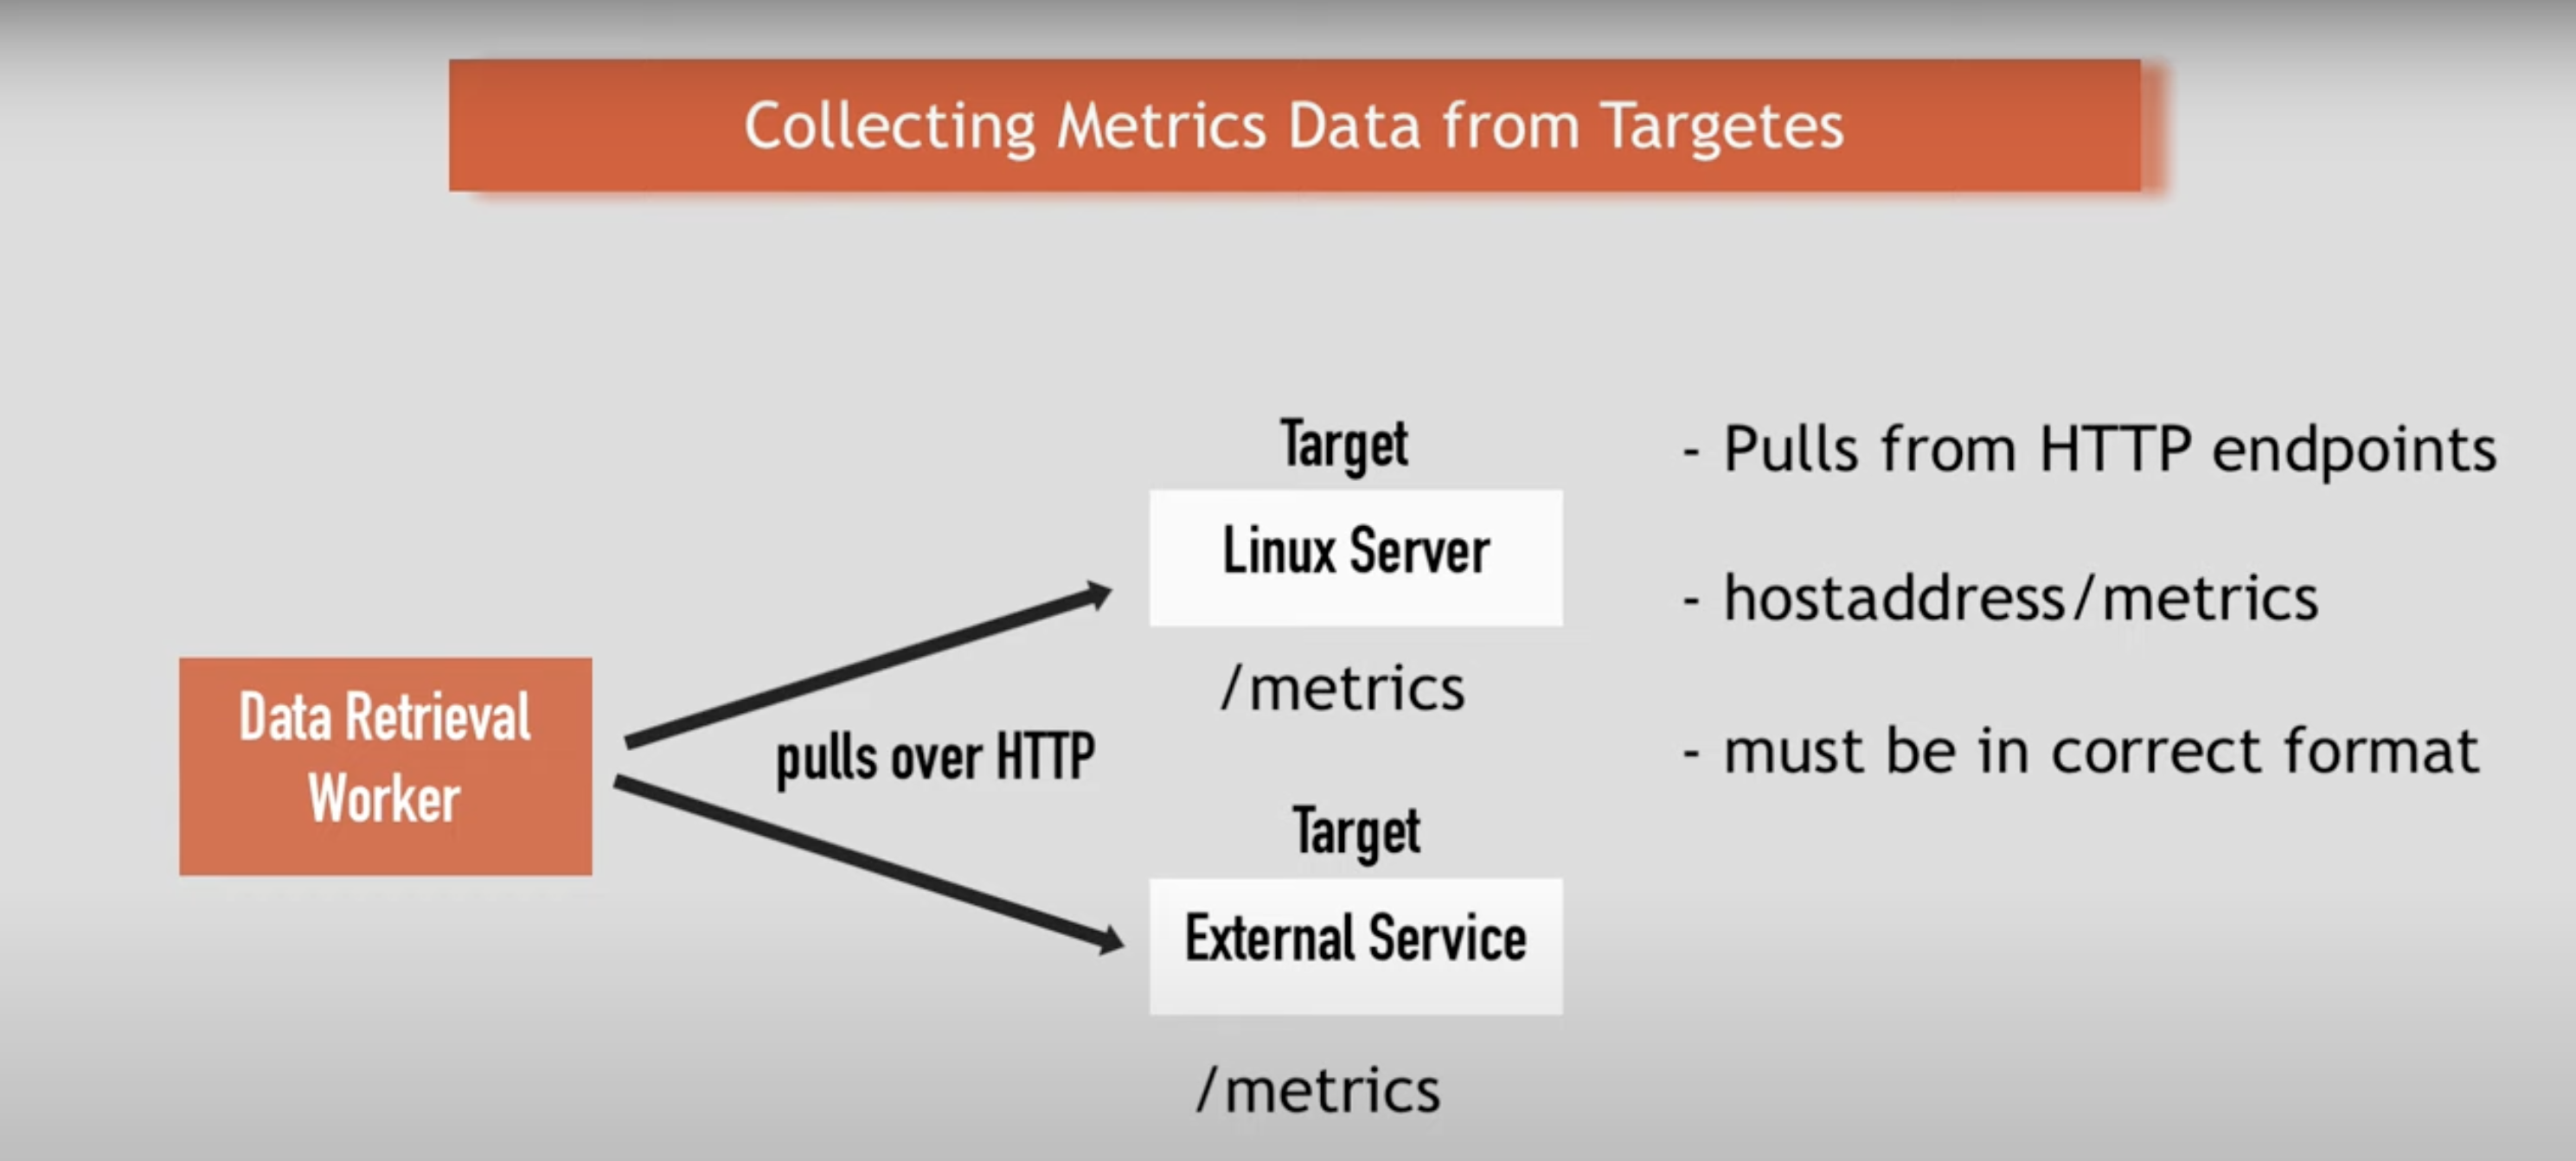
- A data retrieval worker that is responsible for pulling/scraping metrics from external sources and pushing them into the database
- A web server that provides a simple web interface for configuration and querying of the data stored.
